Using Low-Cost Sensors for Source Attribution and Health Assessment: An Air Quality Study in Brownsville, Texas
Published in Atmospheric Environment: X [IF:3.4], 2025
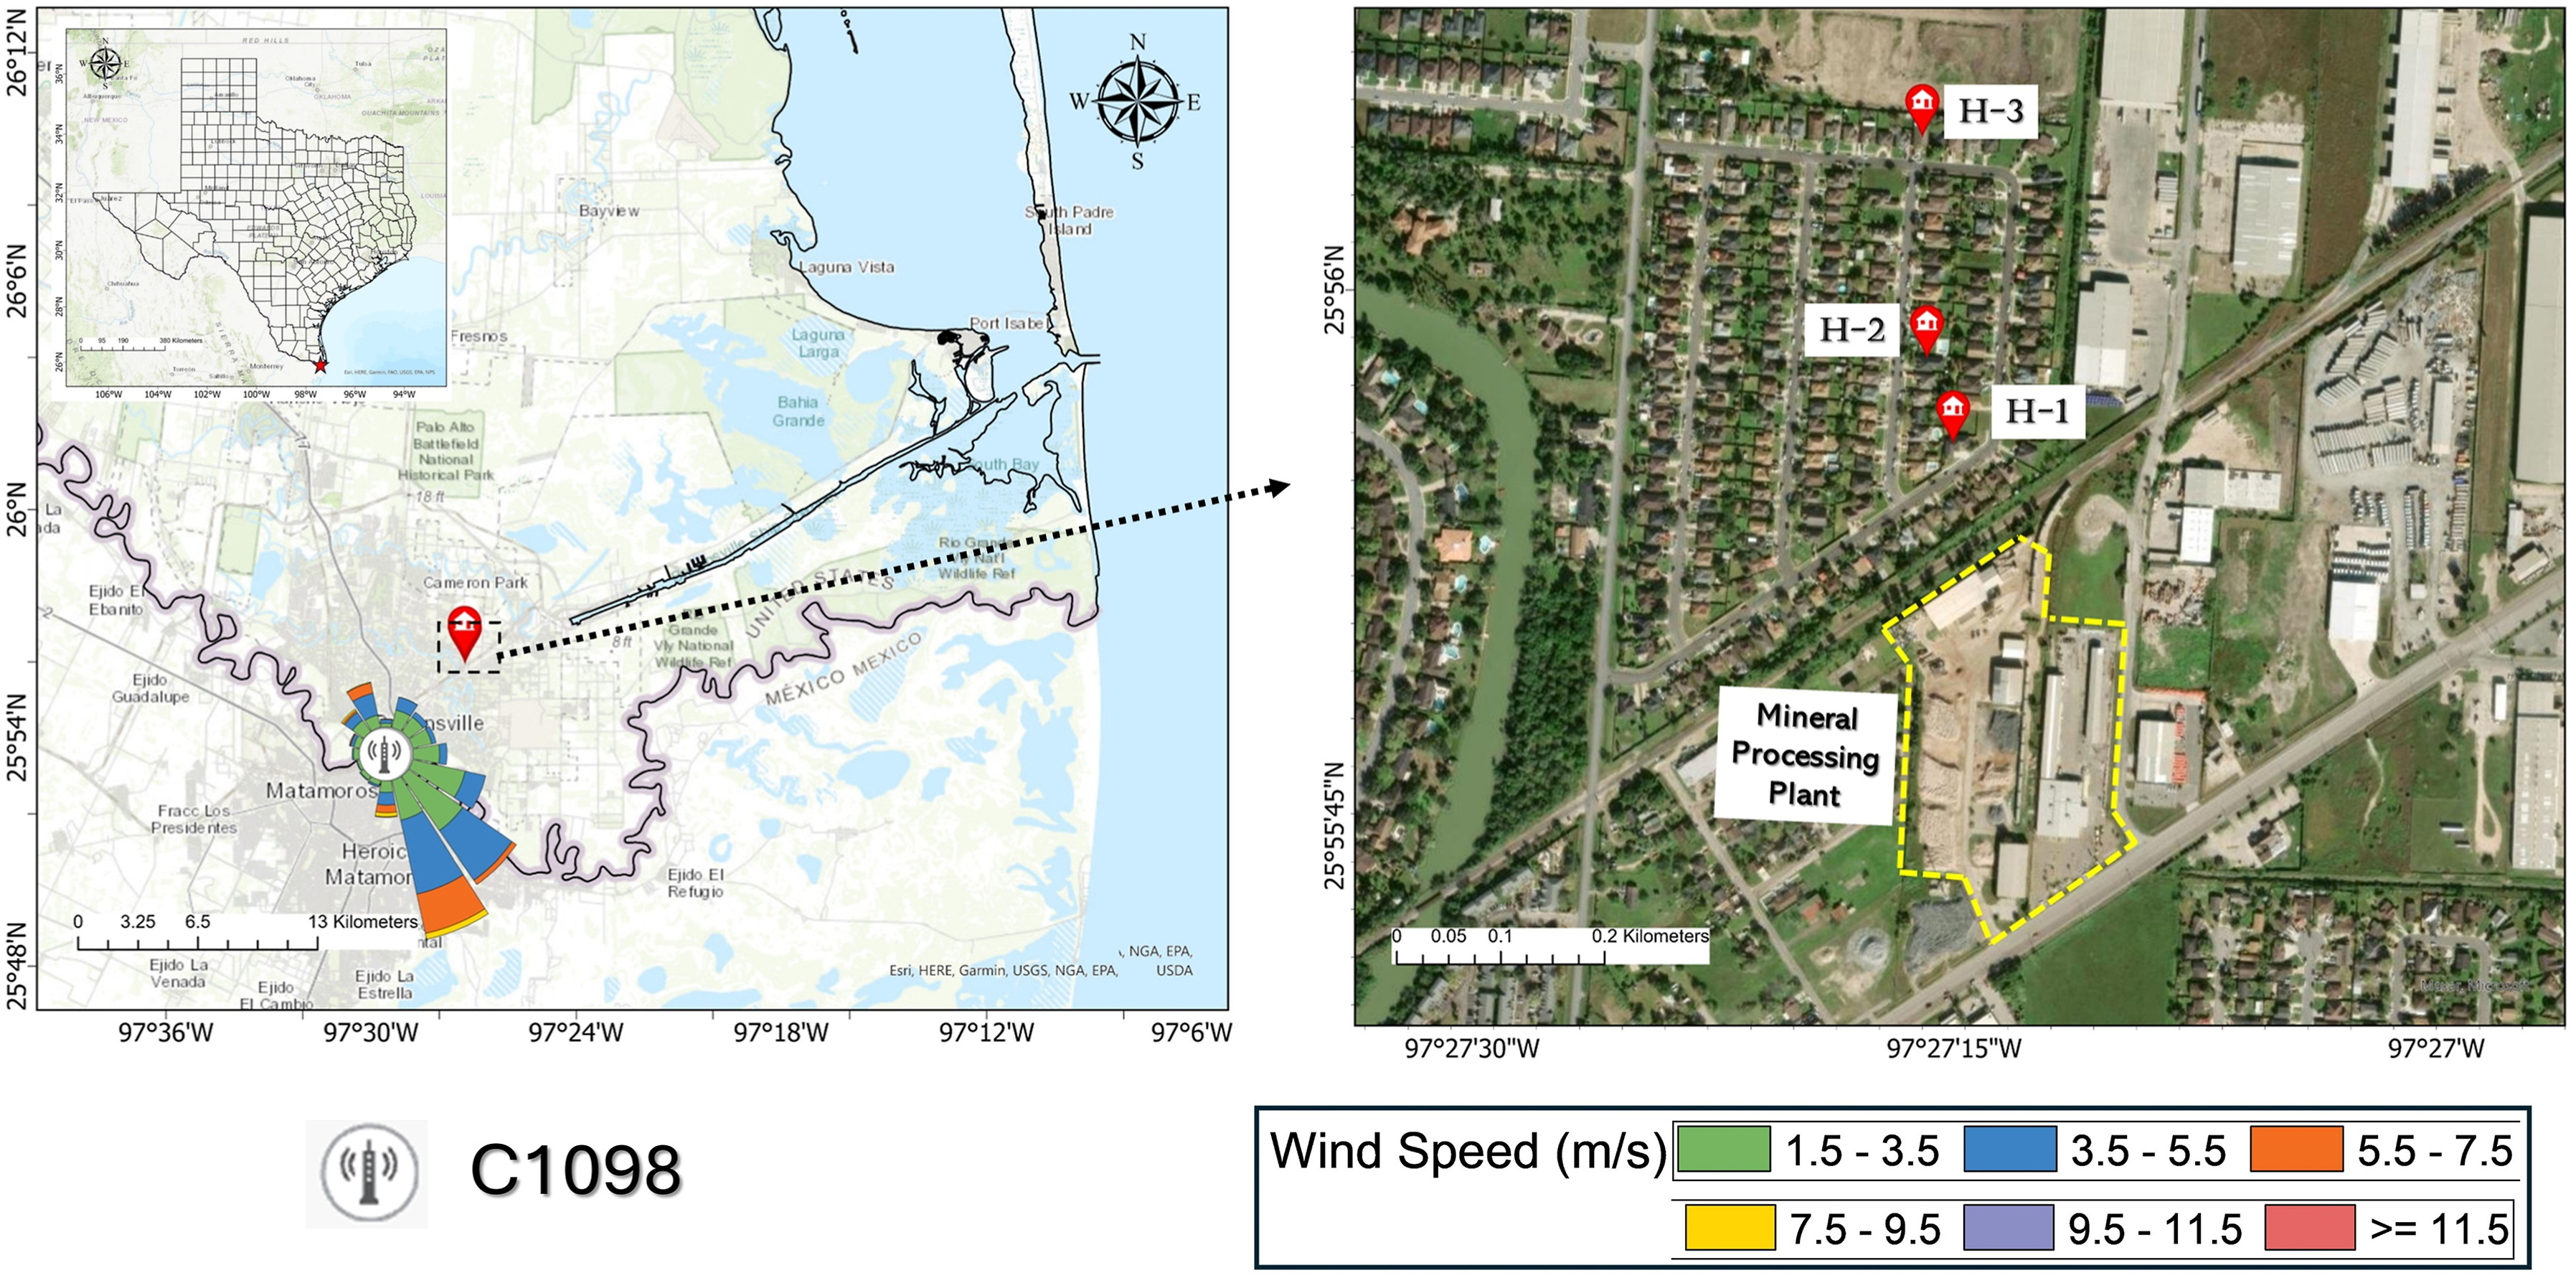
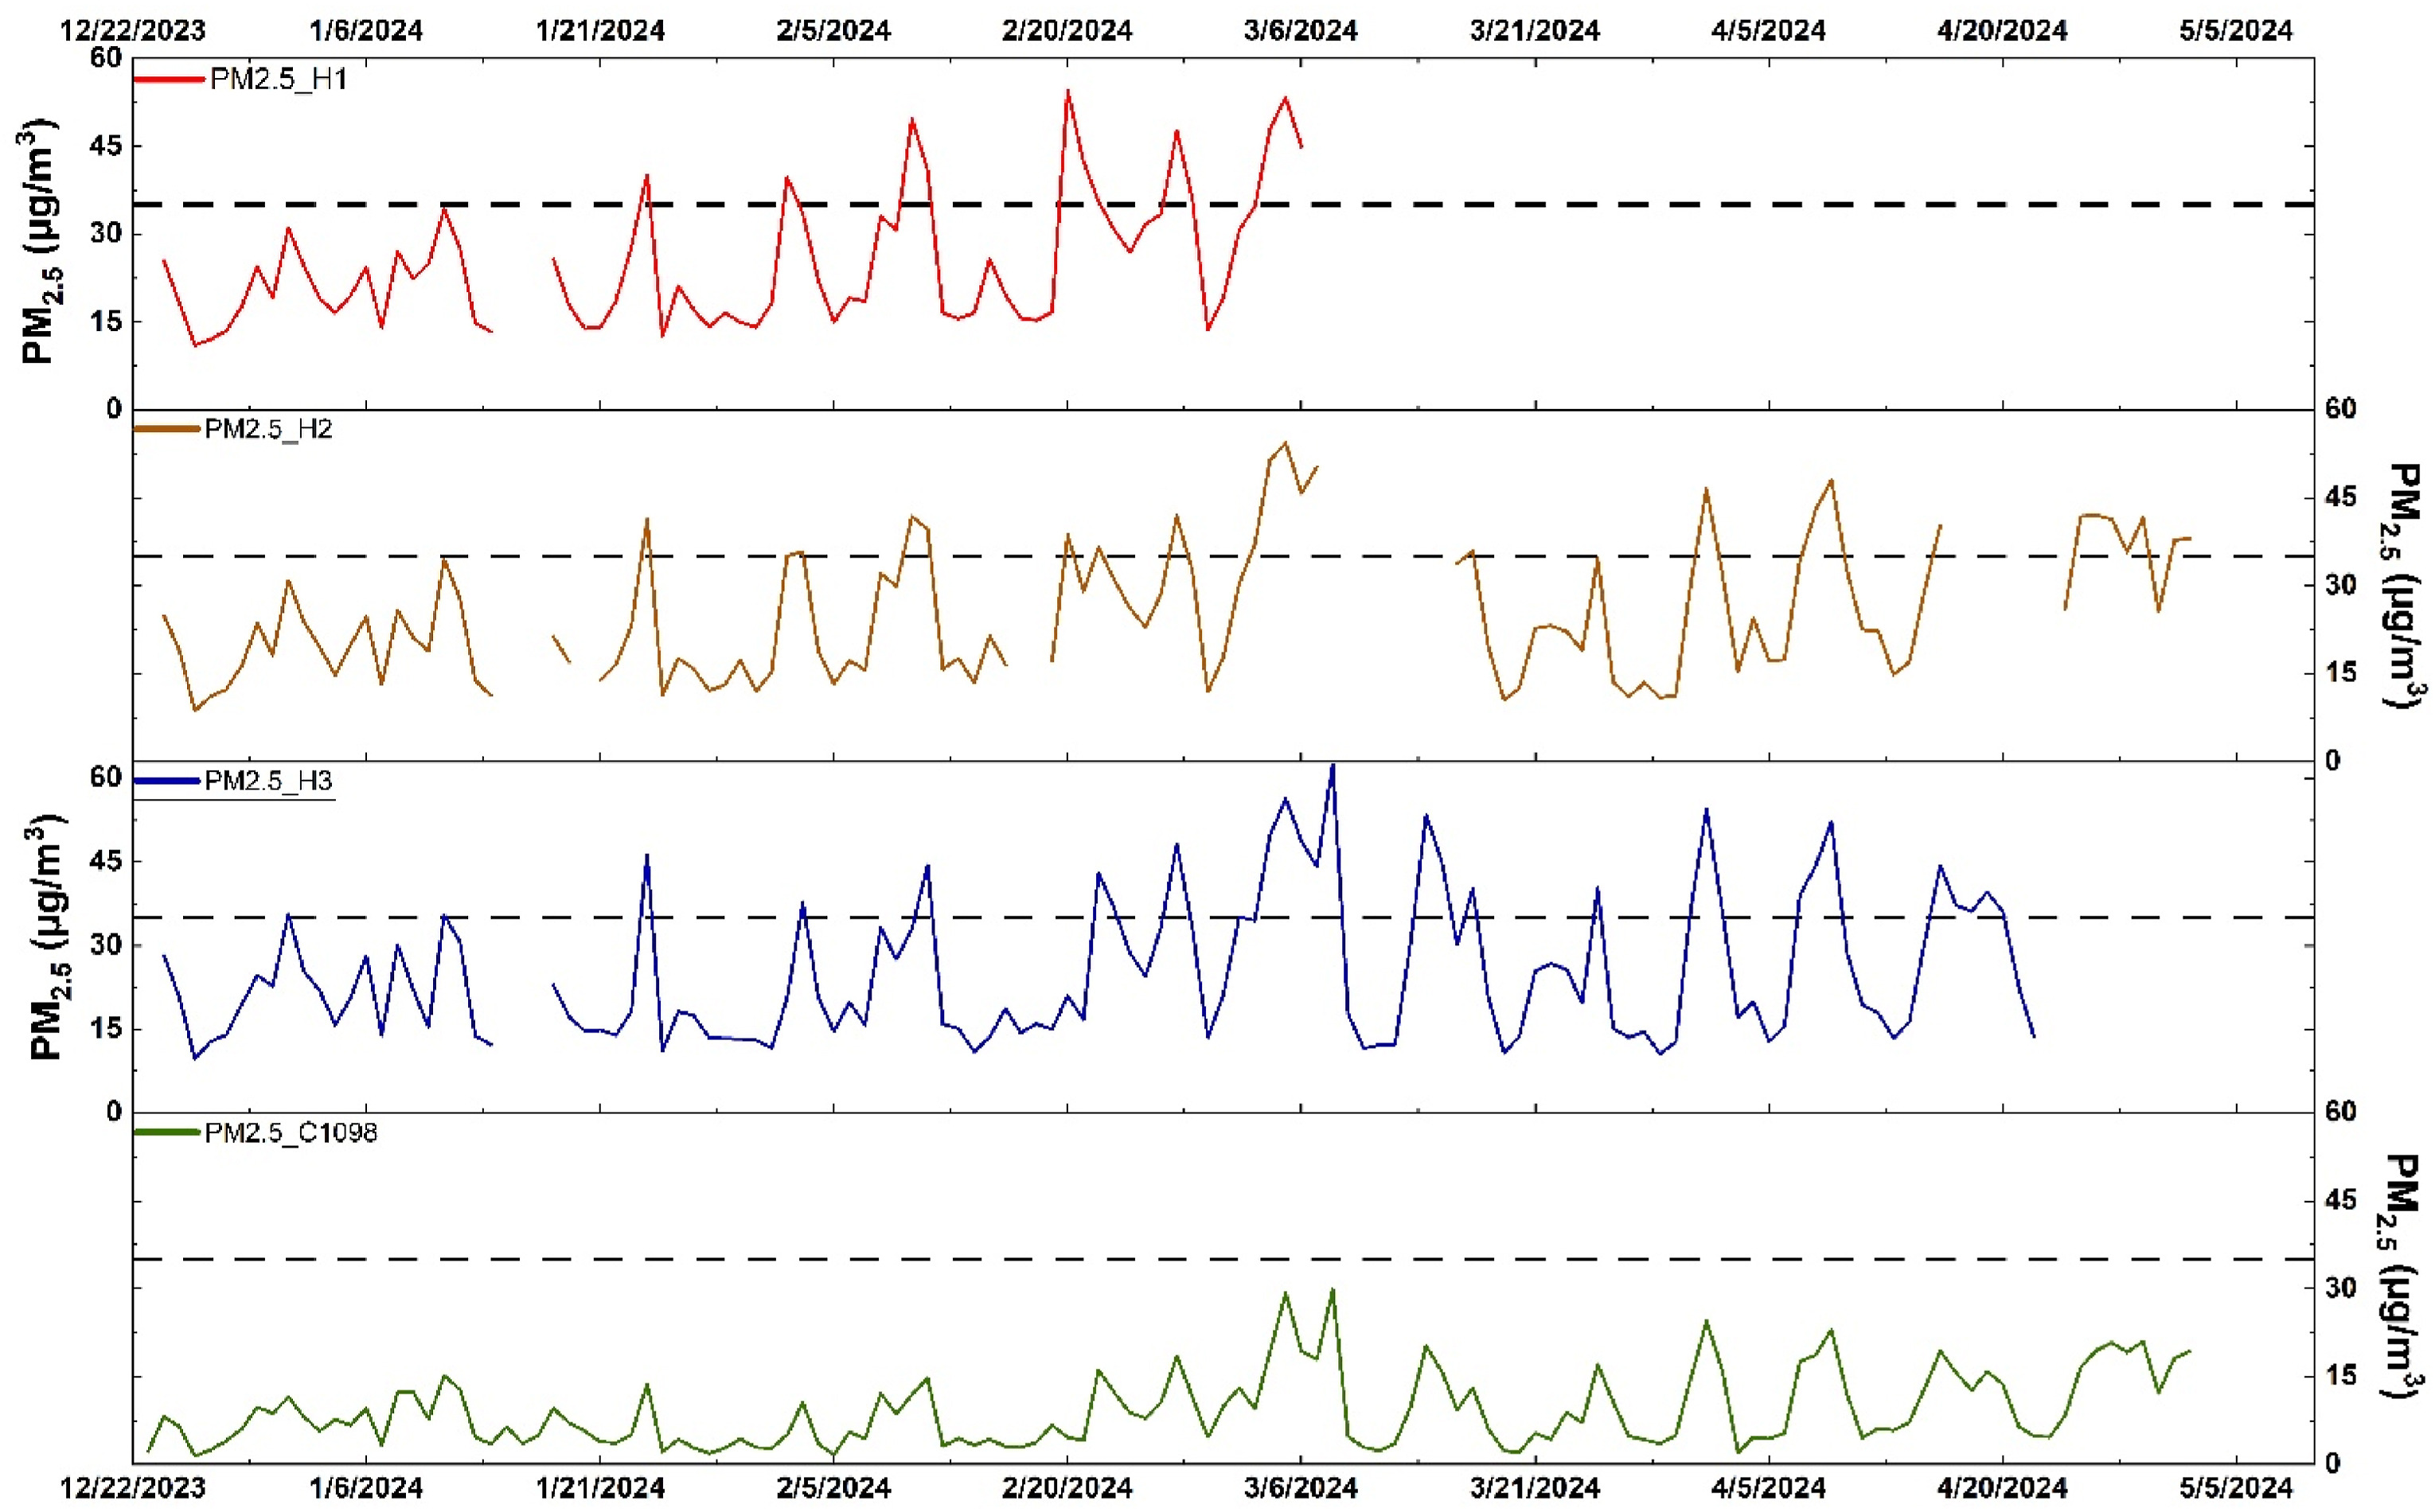
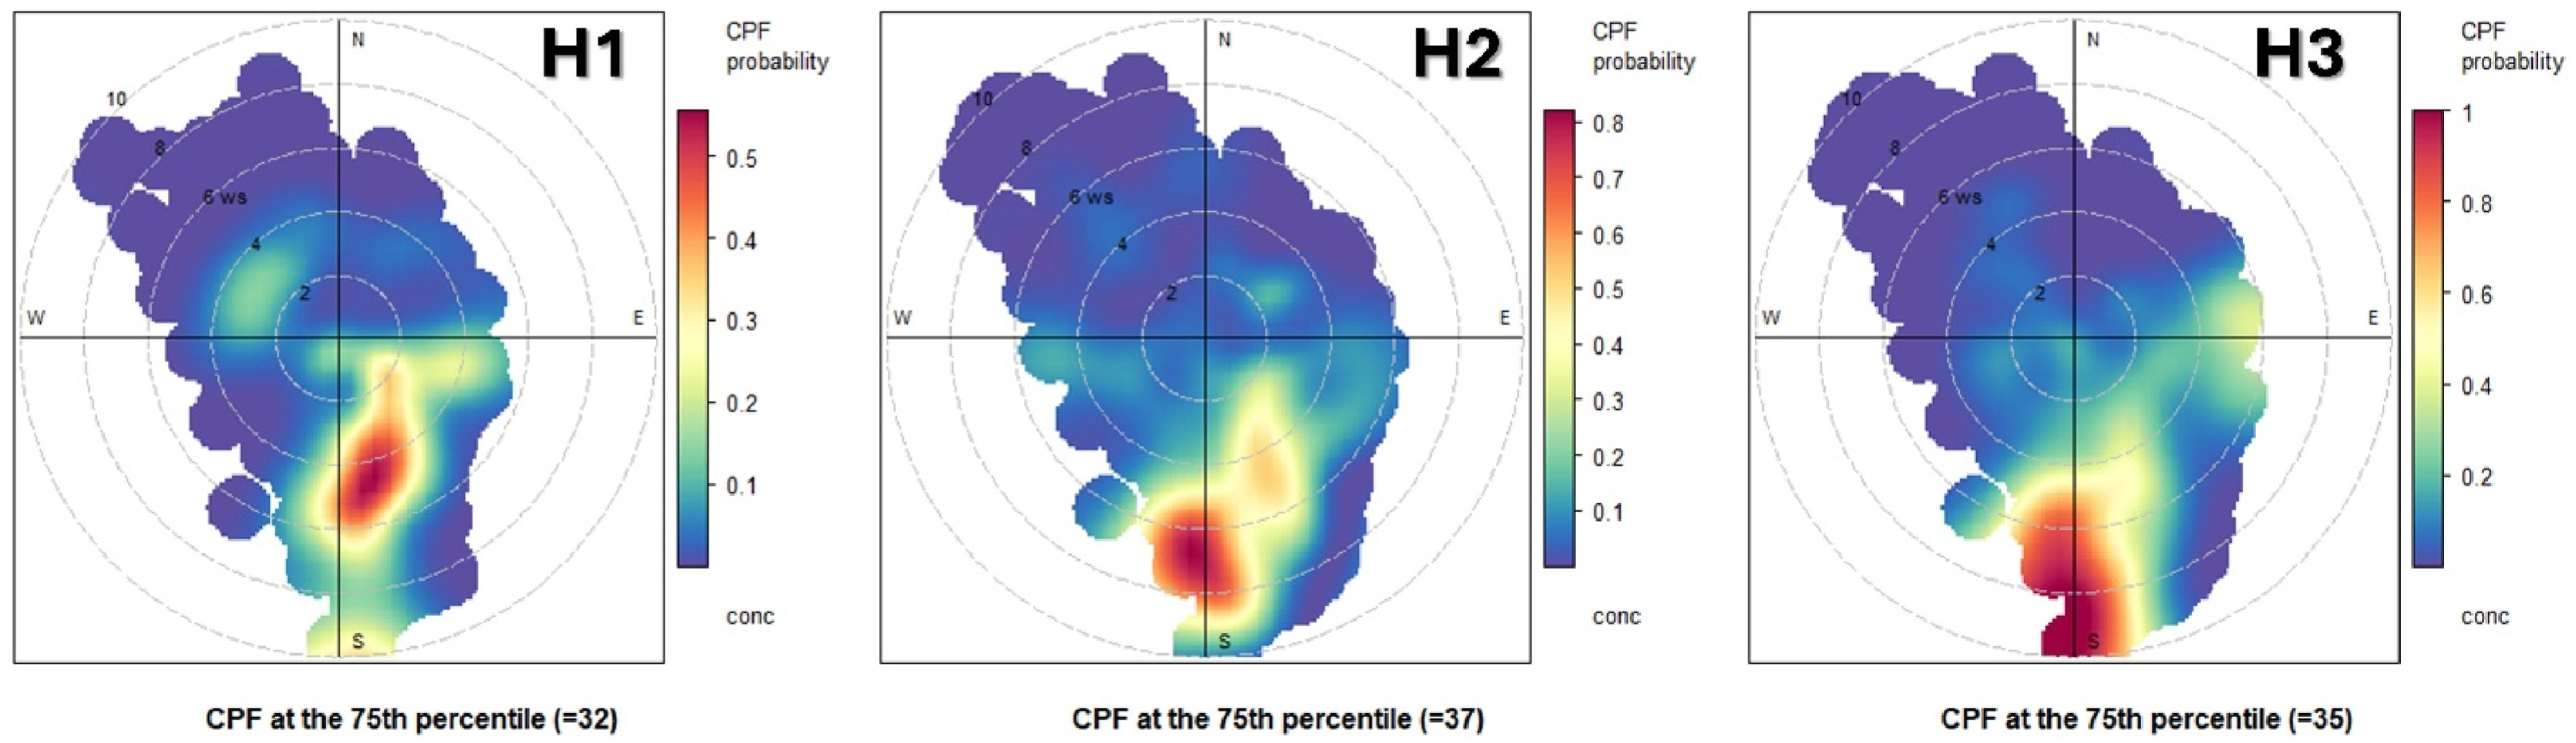
Air quality monitoring remains a challenge in areas lacking or having sparse federal monitoring infrastructure, posing significant barriers to public health research. This study demonstrates the usage of low-cost sensors in addressing gaps in air quality monitoring, source attribution, and health risk assessment in a Brownsville, TX neighborhood impacted by emissions from a barite and celestite mineral processing unit. PM2.5 concentrations were measured using PurpleAir sensors deployed across three residential locations, with the site nearest to the processing unit recording a 24-h averaged PM2.5 concentration of 25.12 μg/m3 — approximately 2.79 times higher than the nearest Texas Commission of Environmental Quality (TCEQ) CAMS (Continuous Ambient Monitoring Station) site. Indoor air quality was also evaluated in two of the residential units to characterize the influence of outdoor pollution on indoor microenvironment. The local wind data was used to conduct source attribution, and the results suggested that the mineral processing entity located south of the neighborhood was the likely source of particulate pollution in this middle-income neighborhood. A health risk assessment for PM2.5 exposure was conducted, and the results indicate a hazard quotient level below unity, suggesting low-risk non-carcinogenic effects on the community. This study underscores the pivotal role of low-cost sensors in generating localized air quality data, and their potential to support ameliorative evidence-based interventions.
Key Figures from the Published Article