Review of agricultural biomass burning and its impact on air quality in the continental United States of America
Published in Environmental Advances, 2024
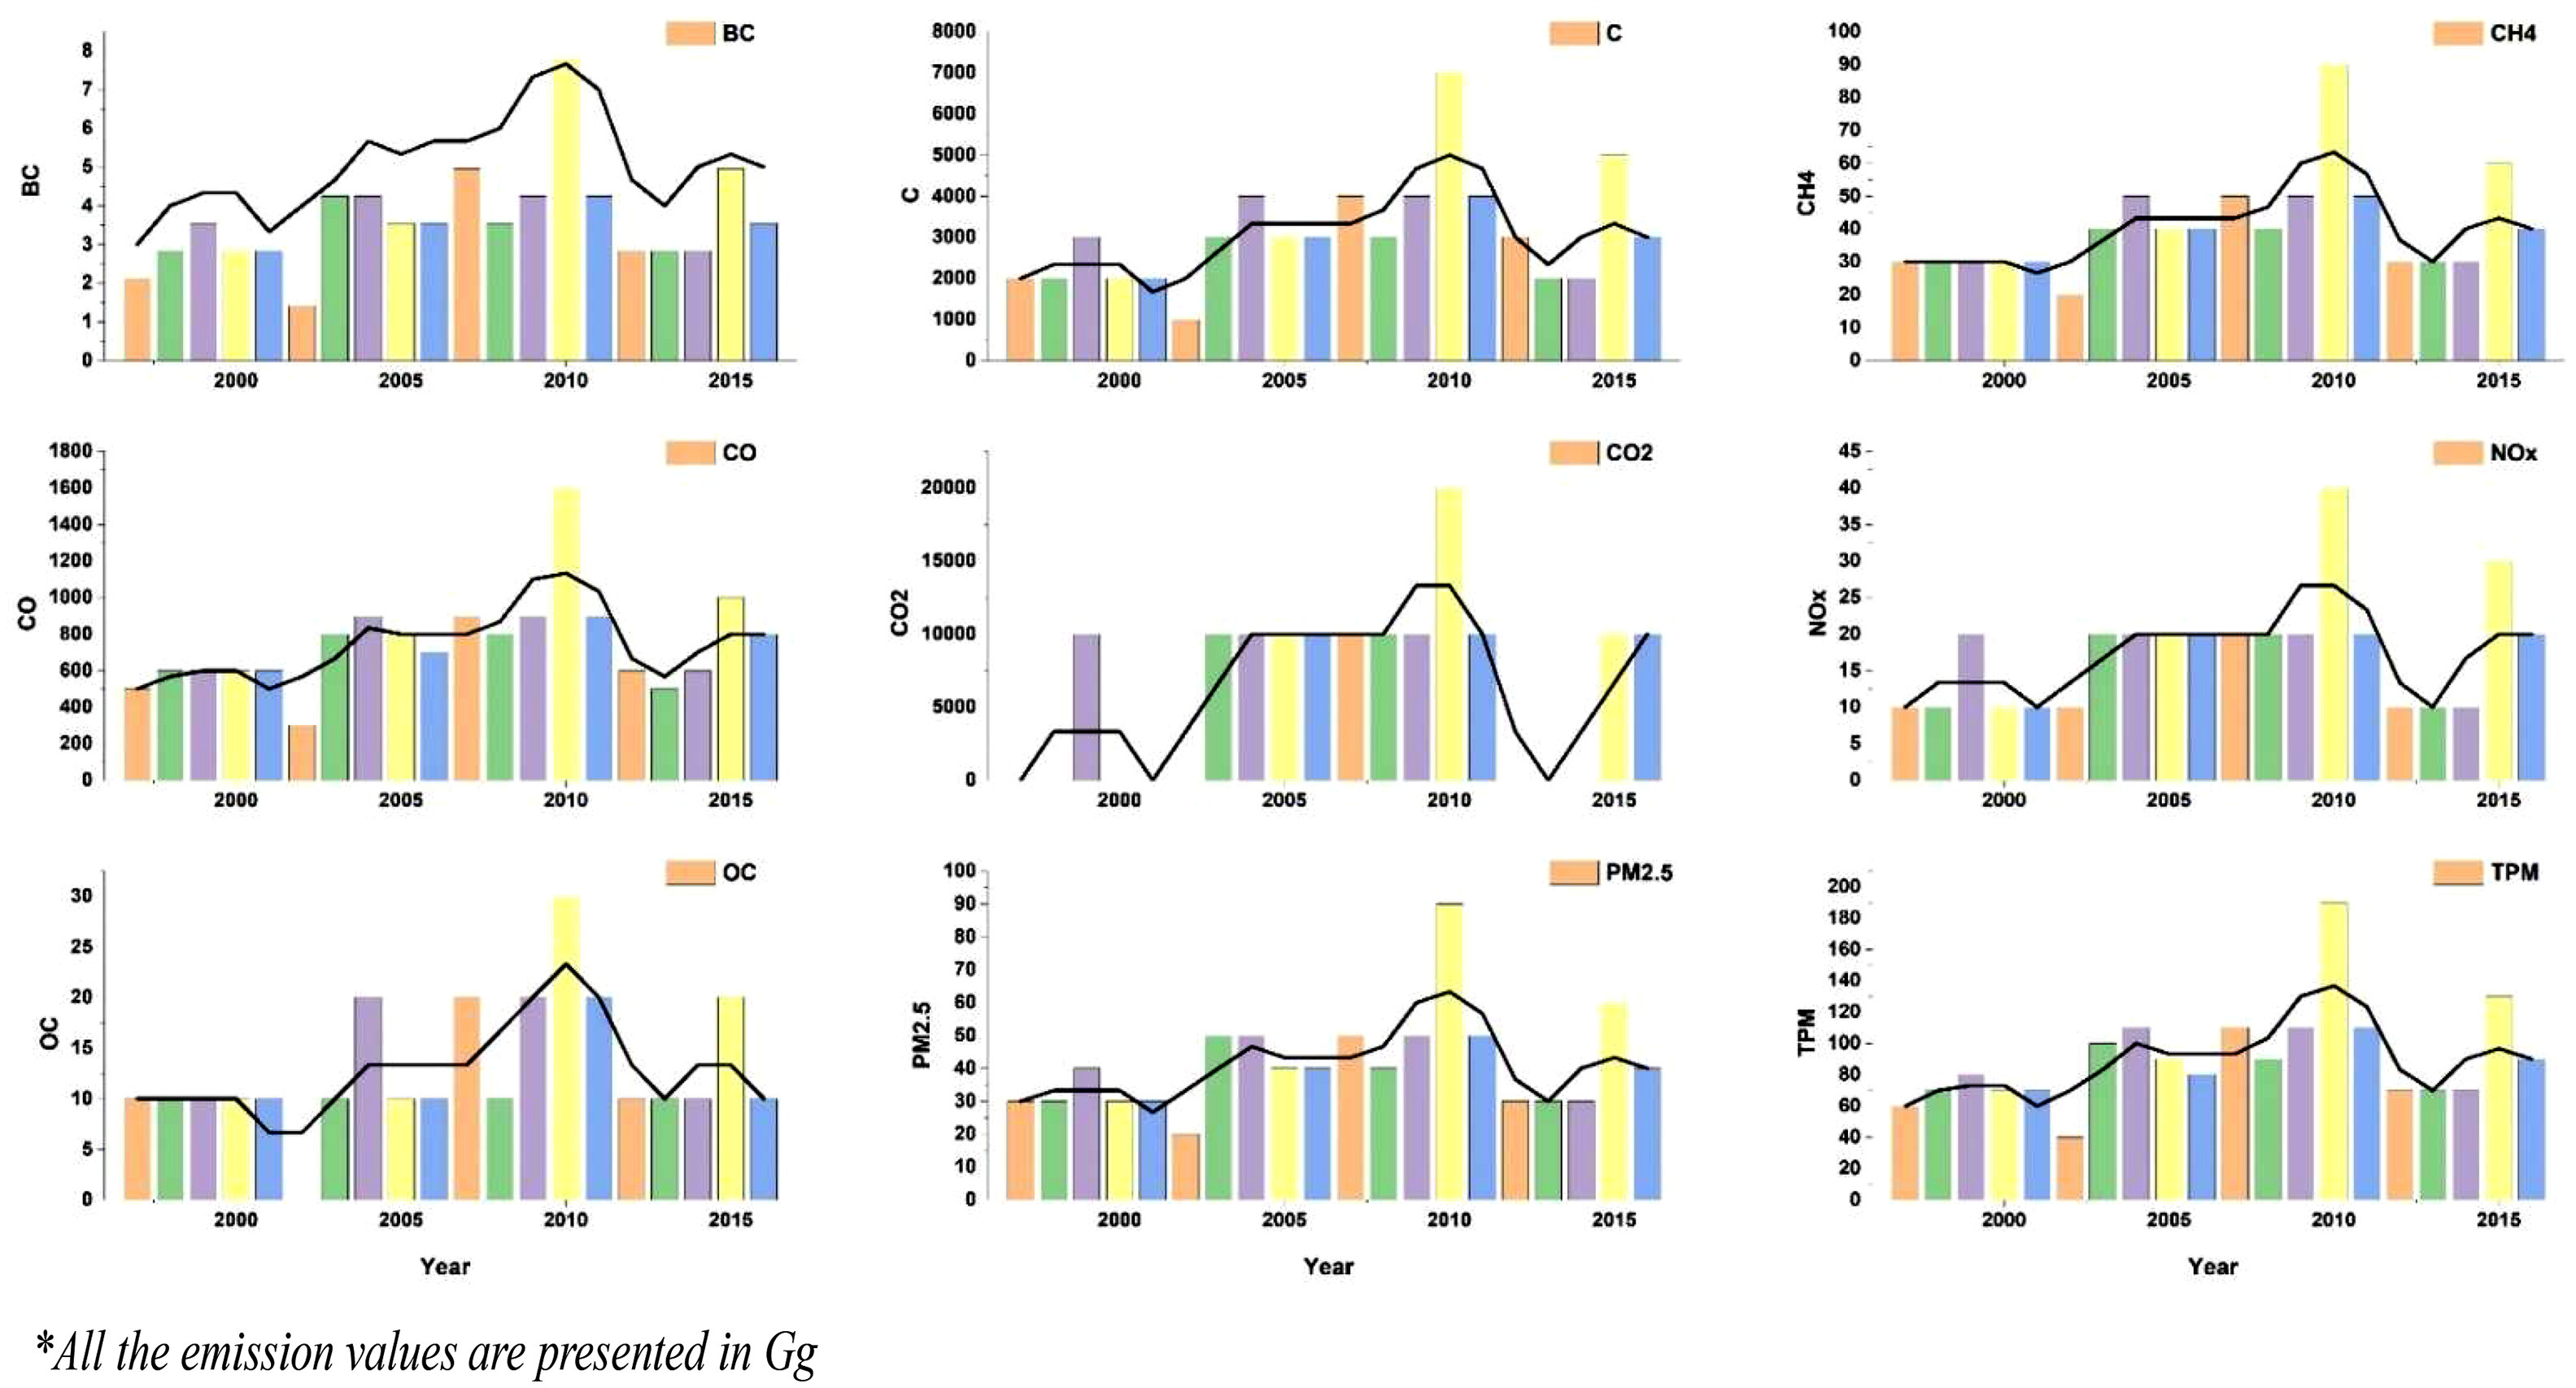
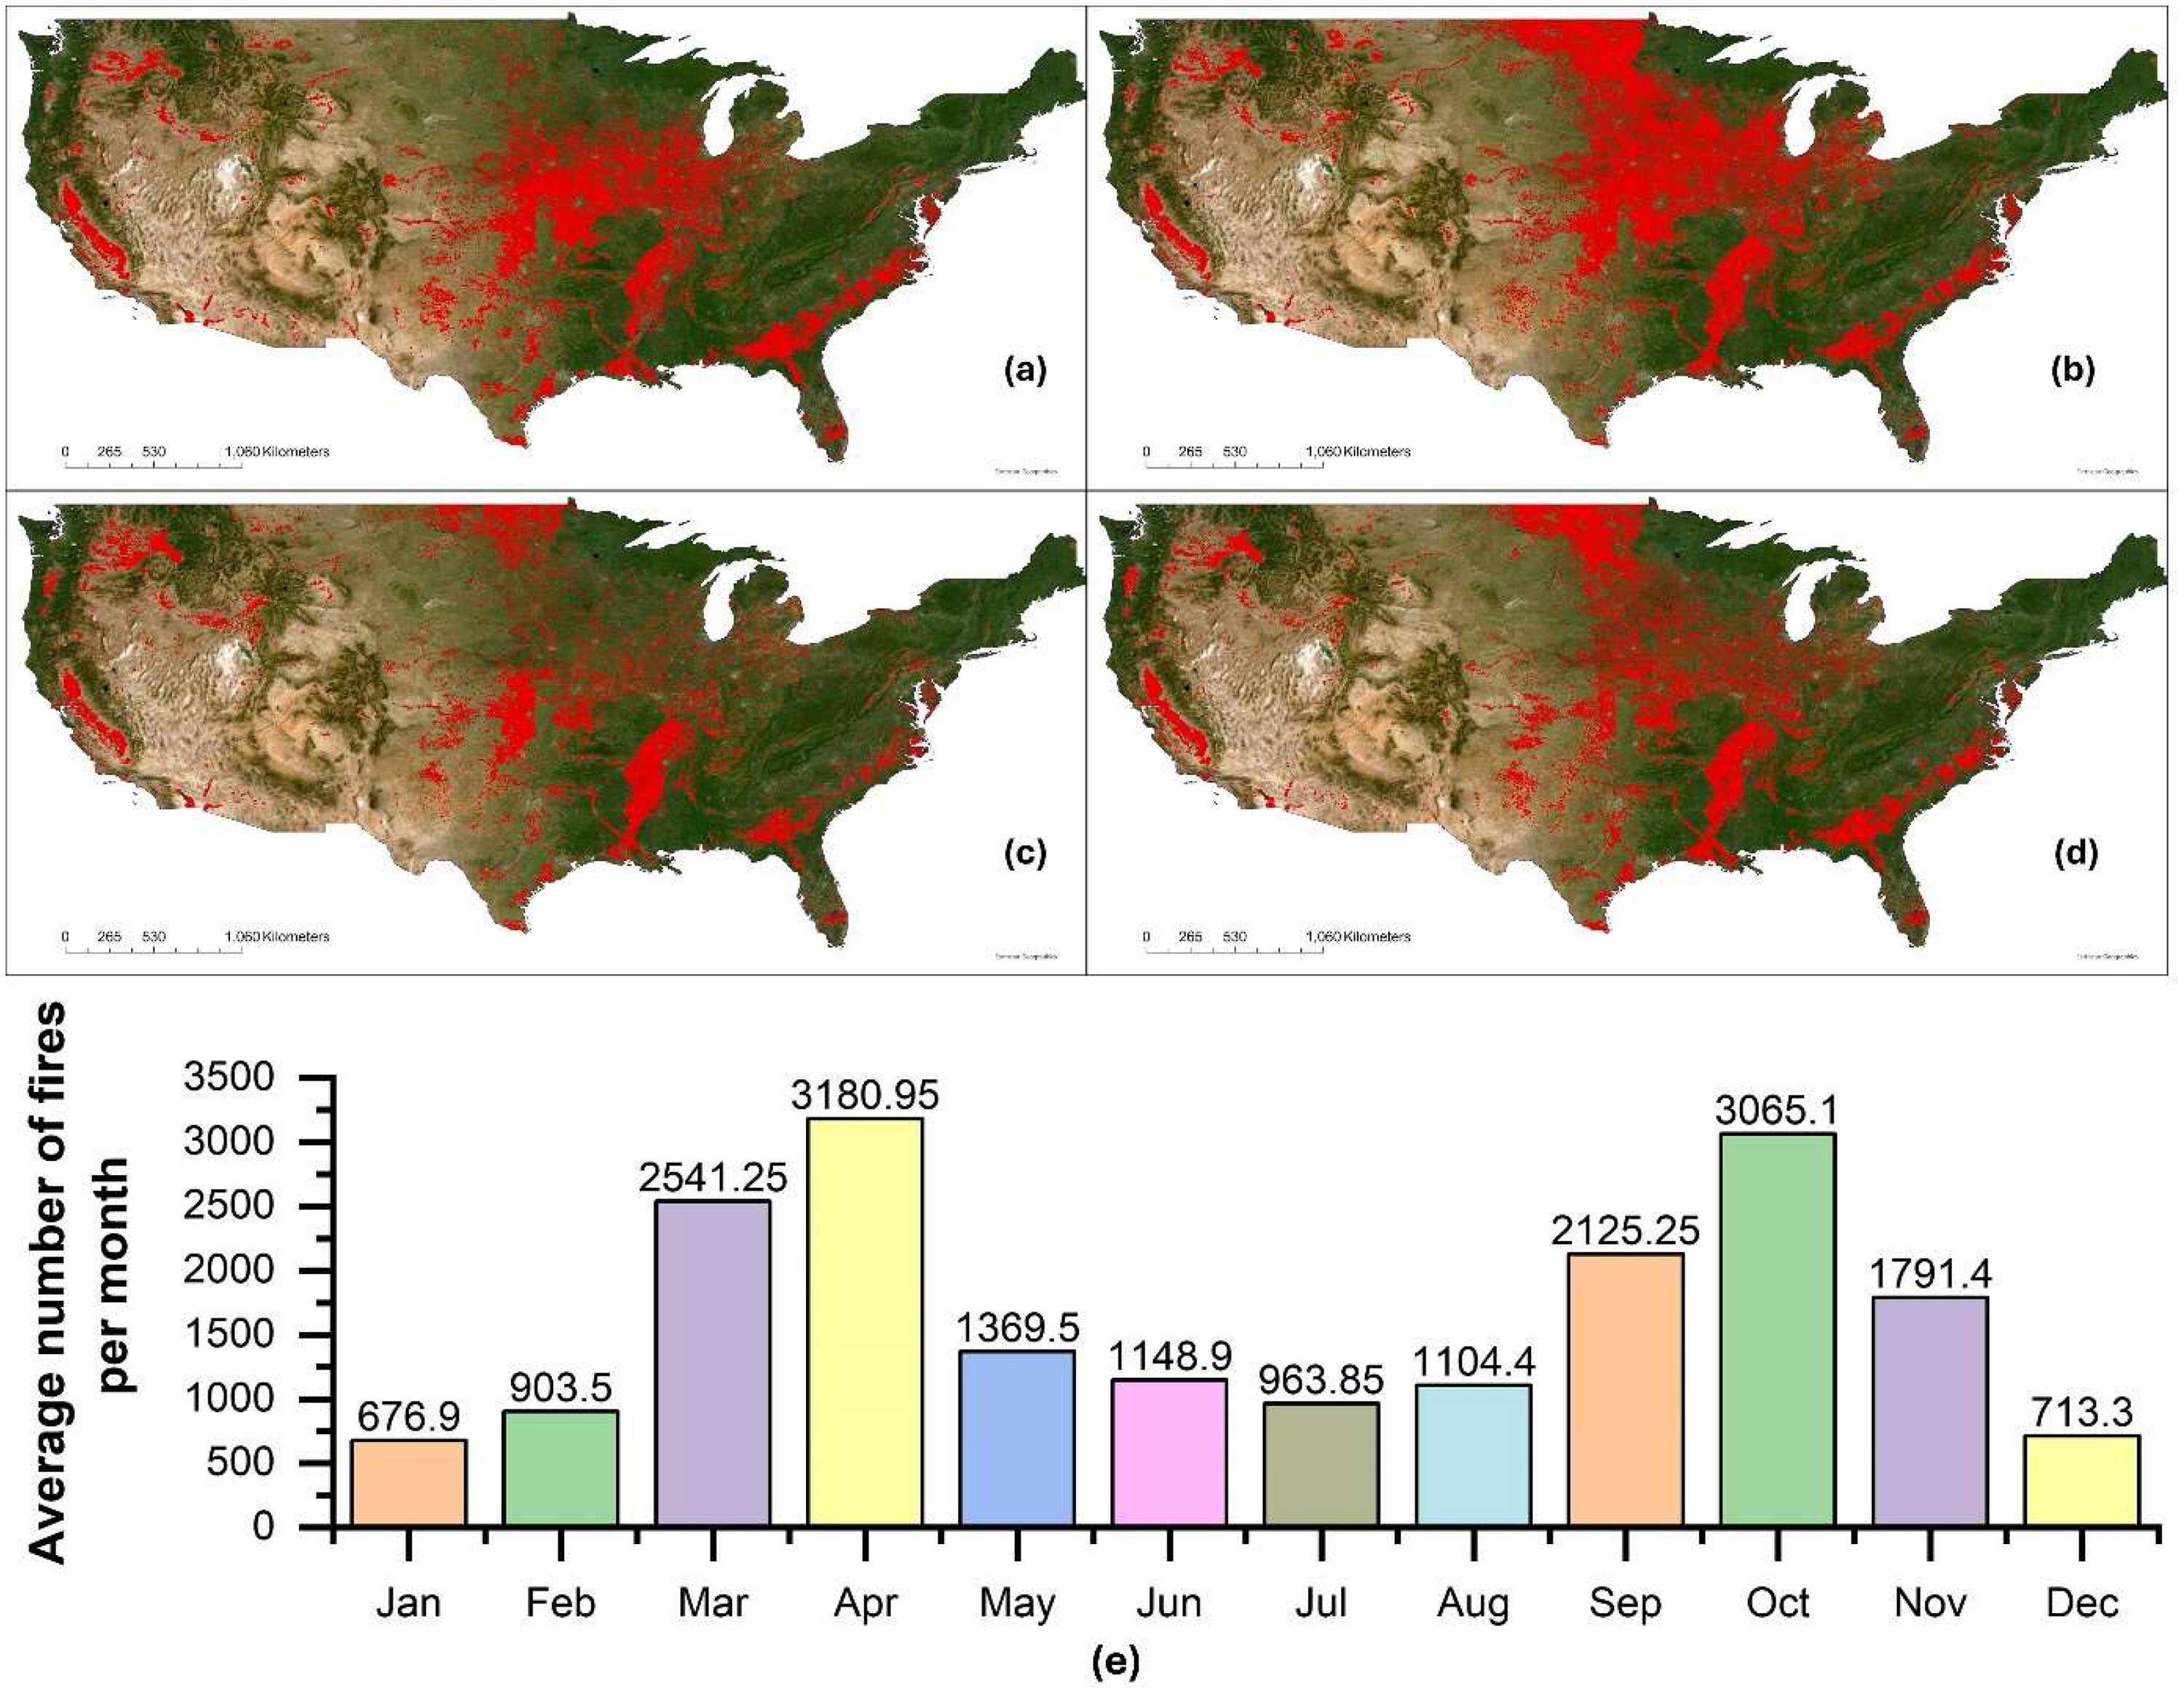
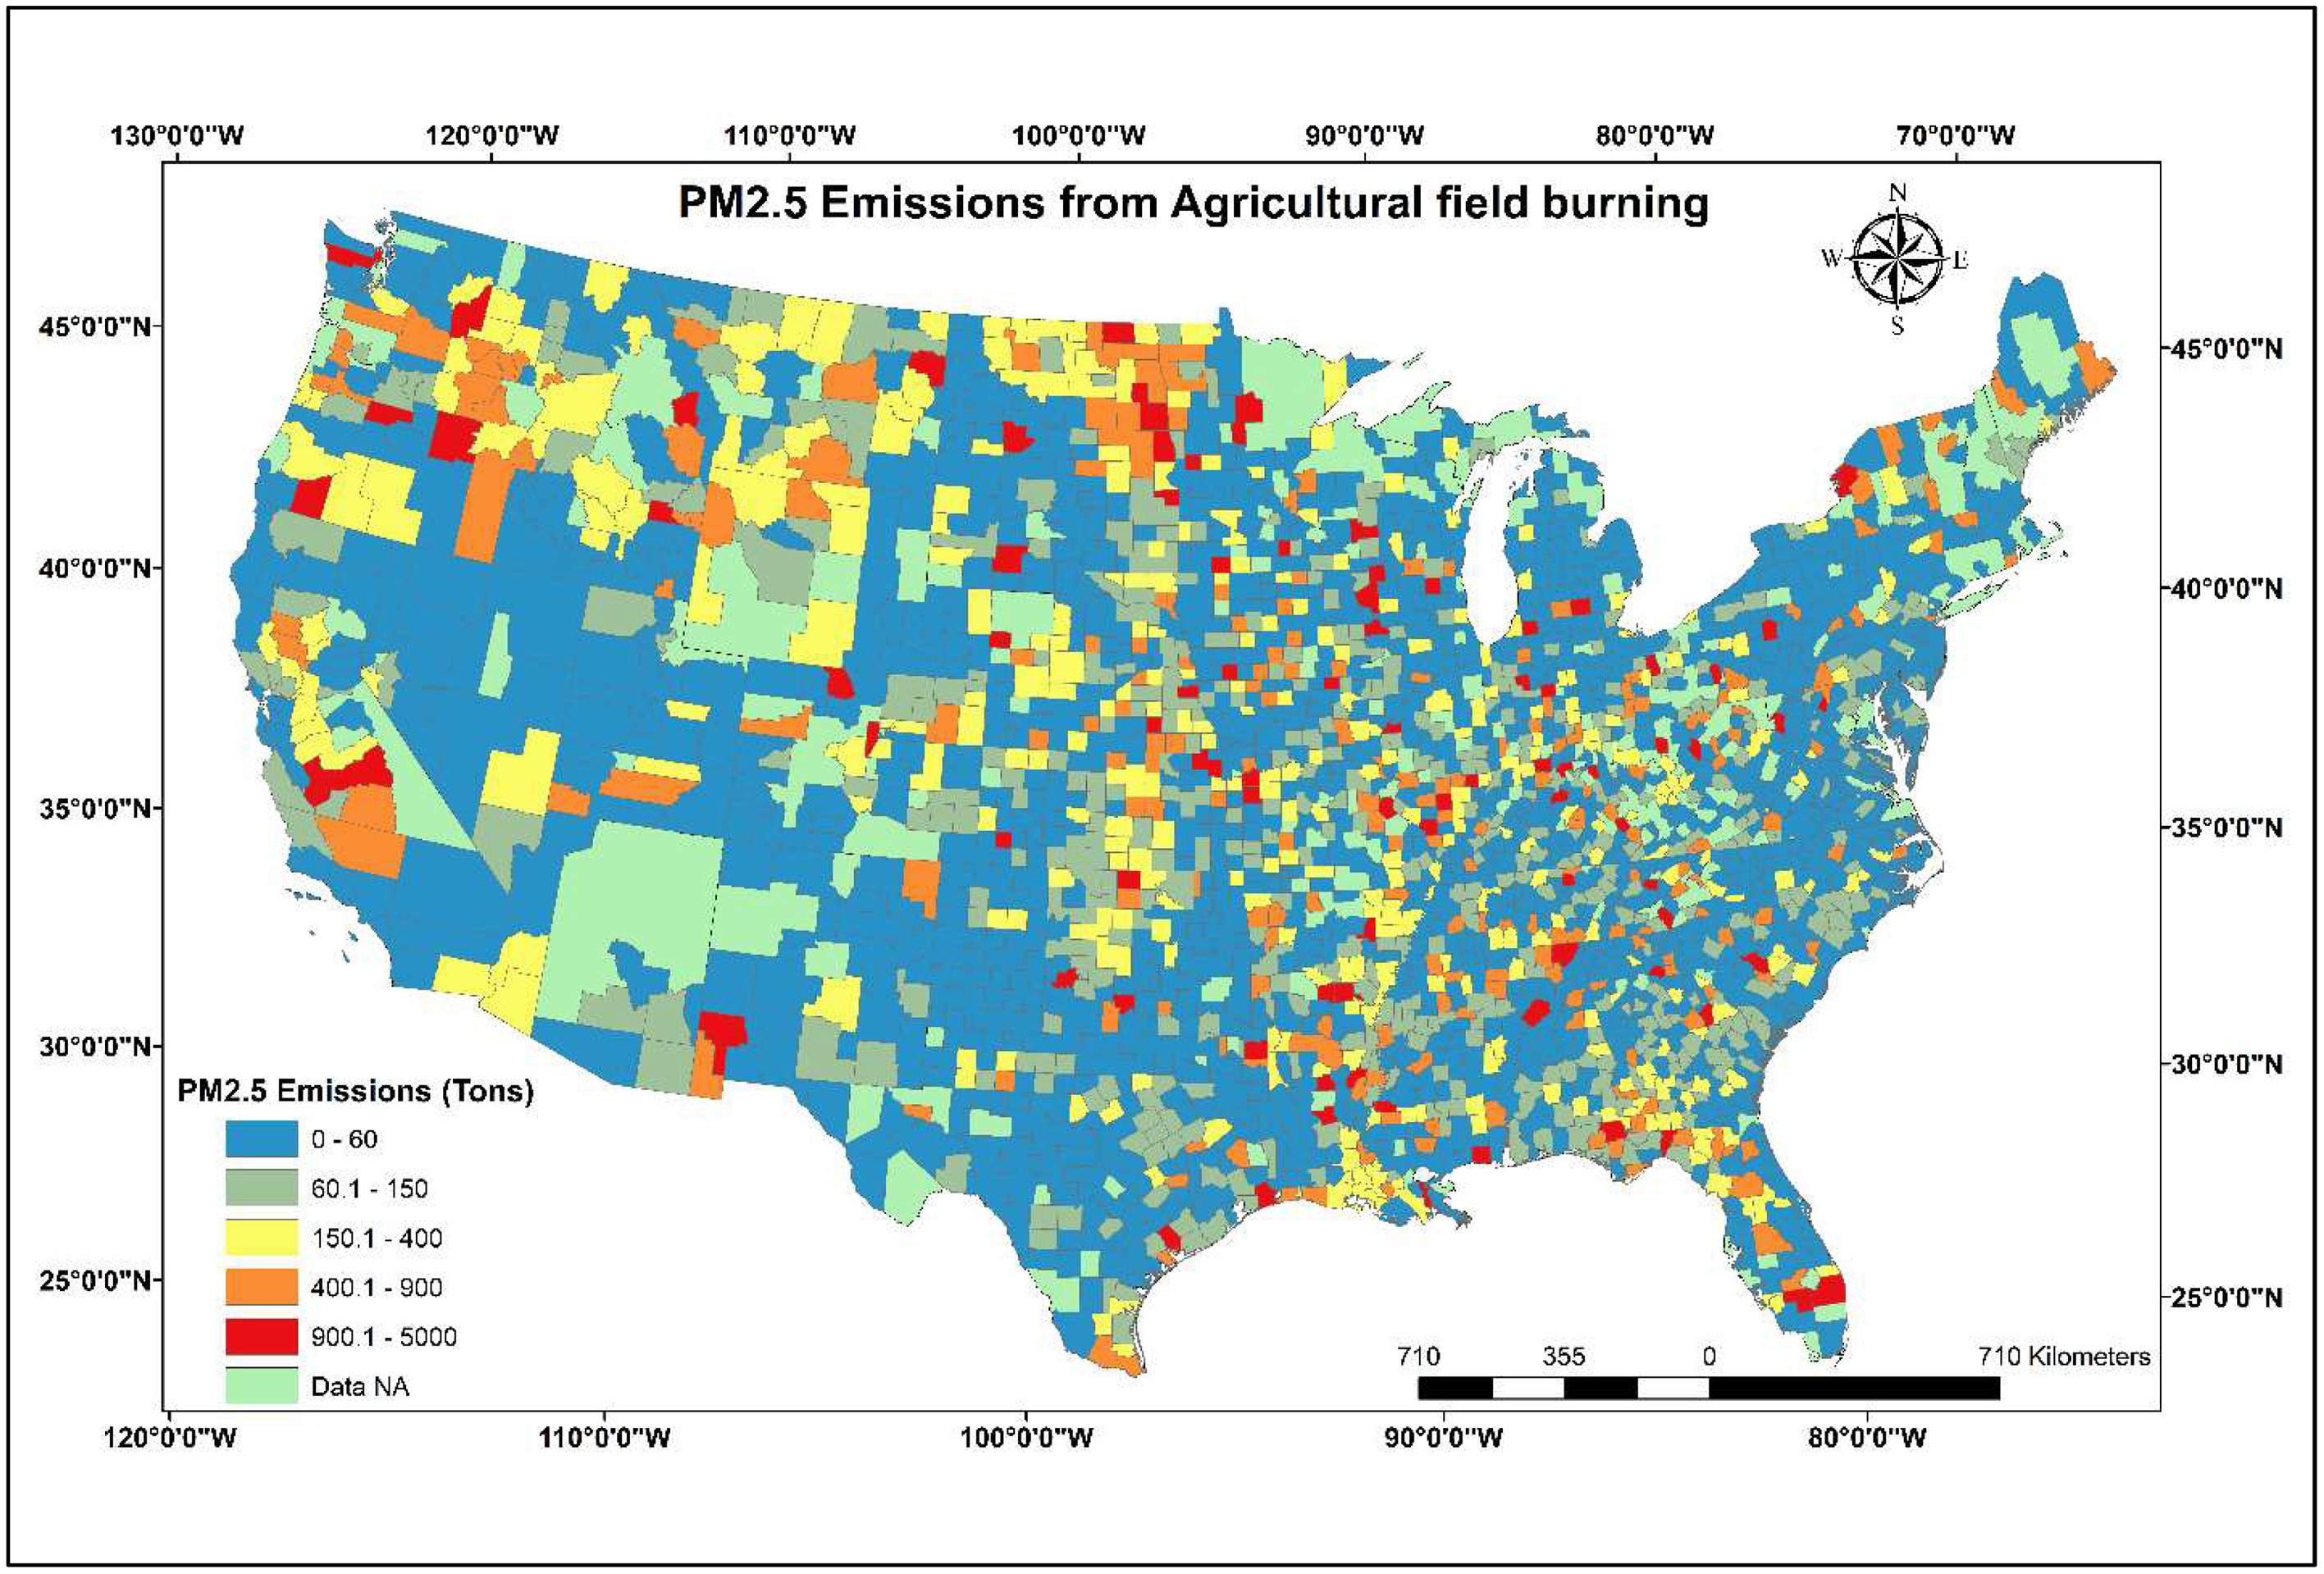
Burning is a common method to dispose agricultural biomass residue. This practice is widely used by farmers during pre- and post-harvest seasons for crops such as wheat, rice, grass seed, soy, cotton, sugarcane, and corn. Farmers choose this method because it is cost and time effective. These burning activities emit several types of pollutants into the atmosphere, including CH4, SOx, NOx, CO, CO2, and particulate matter of different sizes (i.e., PM1, PM2.5 and PM10). Globally, the United States of America ranks third, preceded by China and India, in greenhouse gas emissions due to agricultural burning activities. According to the 2020 U.S. National Emissions Inventory, agricultural field burnings produced 67,309.81 tons i.e., approximately 20 % of total PM2.5 emissions. The main aim of this review paper is to summarize the existing literature on agricultural biomass burning and its effect on air quality in continental USA. This review utilizes databases such as Web of Science, Science Direct, PubMed and ProQuest for this endeavor. Various types of emissions and their emission factors are presented for each type of crop. Additionally, the review also compiles available data from the biomass burning emission inventories to characterize the spatial and temporal patterns of pollutant emissions resulting from agricultural burning. States such as Iowa, Illinois, Indiana, North Dakota, South Dakota, and Nebraska are home to significant amounts of croplands; however, no studies were found focusing on these states. Pollutant emissions from 2008 to 2020 revealed an upward trend from 2017 onwards, suggesting an expansion in agricultural burning areas in contrast to previous years.
Key Figures from the Published Article